


















How a tennis model actually makes a call: serve, return, surface and form
How a tennis model actually makes a call: serve, return, surface and form
A tennis prediction can look deceptively simple on a screen. One player is placed on the left, another on the right, and beside them sits a probability, a projected winner or a confidence score. What the reader does not see is the chain of calculations that turns historical matches into that number.
A serious tennis model does not simply ask who has the higher ranking or who won the previous match. It tries to estimate how the matchup should behave before a ball is struck. That means separating the parts of performance that travel from tournament to tournament from those that depend heavily on opponent, court and recent workload.
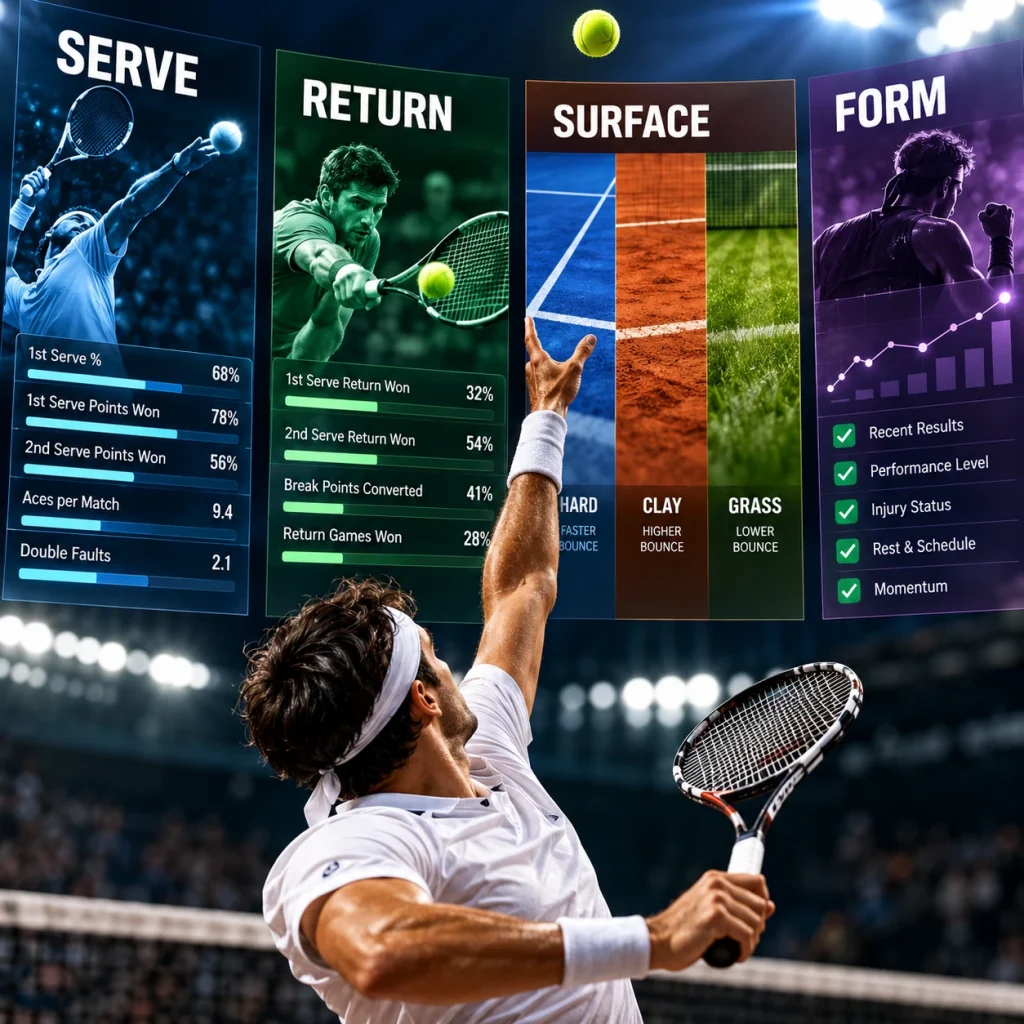
Serve and return sit close to the centre. Surface changes the value of those strengths, while recent form can show whether a player’s current level differs from the longer-term baseline. Ratings, rest and match history add further context. The challenge is combining these variables without letting one eye-catching statistic take over.
Tennis also lends itself to modelling because point-level performance builds into games, sets and matches. Research has long found value in accounting for surface and changing player ability when forecasting results.
The first question is not “Who is better?”
Before estimating a winner, a model has to define what “better” means in the context of one particular match.
A player may have a stronger overall rating but be a less convincing choice on clay against an opponent who returns well and is comfortable in long rallies. A big server can look dominant in a general database but become less imposing on a slower court where the return comes back more often. Another player may enter a tournament with modest season numbers while showing a clear improvement over the last month.
A prediction engine therefore converts match history into comparable signals: wins and losses, serve and return points, break performance, aces, double faults, surface results and opponent level. It then determines how much weight each signal deserves and how quickly older evidence should fade.
The ATP’s current statistical system illustrates how detailed this can become. Its serve leaderboard separates first-serve percentage, first-serve points won, second-serve points won, service games won, aces and double faults, while the return leaderboard tracks first- and second-serve return points won, return games won and break points converted. Those categories are far more informative for a matchup model than simply counting aces or reading the players’ rankings.
Serve is more than the ace column
The serve is often the most visible statistical edge in a match, but an effective model looks beyond headline numbers.
First-serve percentage matters because it affects how often a player gets to use the more advantageous delivery. First-serve points won show what happens when that serve lands. Second-serve points won reveal whether the player remains competitive after missing the first attempt. Service games won bring those separate ingredients closer to the match outcome.
Aces can help describe serving quality, but they are not a complete measure. Two players can hit a similar number of aces while differing substantially in double faults, second-serve effectiveness or the number of returnable points they face. A player who wins a high share of service points without producing spectacular ace totals may be a more stable proposition than a player whose serve is dependent on short bursts of free points.
This is also where opponent quality matters. A serve percentage collected against weak returners should not automatically be treated as equivalent to the same percentage against elite returners. A well-built model therefore needs some way to adjust the evidence for the standard of opposition, either through ratings, opponent-adjusted performance or the broader training process.
Return performance changes the entire matchup
The other side of the equation is return quality. In many prediction discussions, the return gets less attention because it is not as easy to summarize with a single spectacular number. Yet a strong returner can directly reduce the advantage of a server who looks dangerous in isolation.
ATP’s published return measures include the percentage of first-serve return points won, second-serve return points won, return games won and break points converted. That breakdown matters because first and second serves create different starting conditions. A player who is particularly strong against second serves may put persistent pressure on a server even without producing many highlight-reel returns.
For a model, the interaction matters more than either return statistic alone. If Player A serves well but Player B is unusually effective against the first delivery, A’s expected edge should shrink. If A’s second serve is vulnerable, the adjustment can become larger.
That is why “best player wins” is too crude. Tennis is a chain of matchups: serve meets return, vulnerable service games affect set probability, and set probability feeds the match forecast.
Surface is a filter, not a footnote
Court surface is sometimes treated as a simple label: hard, clay or grass. For prediction purposes, it is much more than that.
The ITF’s Court Pace Classification Programme places court surfaces into five speed categories, from slow to fast, using Court Pace Rating. The 2026 ITF Technical Booklet groups the ratings as slow, medium-slow, medium, medium-fast and fast. In other words, even within the same broad surface family, pace can differ.
That matters because court conditions change the relative value of certain playing styles. On a quicker court, a high-quality first serve can be harder to neutralize and short rallies can become more common. On slower clay, the return and the ability to sustain pressure through several exchanges can carry more importance. Grass creates another environment in which serve, first-strike tennis and reactions to a lower bounce can matter strongly.
A prediction model does not need to pretend that every tournament has an entirely unique surface. It needs to avoid the opposite mistake: assuming that a player’s overall record has exactly the same meaning everywhere.
This is where surface-specific ratings and surface-specific rolling statistics become useful. Academic work on tennis forecasting has shown that models can construct player abilities that differ by court surface, while modern prediction projects routinely test or blend overall and surface-specific ratings.
Imagine a player who is a strong hard-court competitor but has only modest clay results. If an opponent with a lower overall rating arrives with a stronger clay record, the model should not erase that information simply because the ranking says otherwise. The surface acts as a filter through which the other statistics are interpreted.
Form has to mean more than a winning streak
Recent form is another area where prediction systems can easily go wrong.
A simple five-match record can be useful as a snapshot, but it can also create false confidence. Five wins over lower-ranked opponents are not the same evidence as five competitive wins over elite players. A loss in a tight three-setter is not identical to a flat straight-set defeat. A player may also be carrying heavy workload into the next tournament.
Form is therefore better treated as a group of recent signals: win rate, surface results, rolling serve and return performance, opposition quality, rest and workload.
The time window matters. A long window is stable but slow to react; a short window reacts quickly but is noisy. Blending time scales lets the baseline remain stable while recent evidence can still move the estimate.
This approach also guards against the classic mistake of treating momentum as a law of nature. A player does not become dramatically better because of a four-match winning streak. The streak matters because it may be evidence of a broader shift in performance, especially when the underlying serve and return numbers have moved in the same direction.
Where the calculation becomes a matchup
At this stage, the model has several views of each player: general strength, surface fit, recent form, serving performance and returning performance. The next step is to stop evaluating those features independently and create a matchup.
This is the point where the question shifts from “How good is Player A?” to “How does A’s game interact with B’s?”
A model might compare A’s projected service performance with B’s return strength, then perform the reverse comparison for B. It can also incorporate an overall rating such as Elo, where each match updates a player’s estimated strength based on the result and the opponent. Surface-adjusted Elo is especially useful because it allows the model to distinguish general ability from court-specific performance. Published research has used dynamic ratings and surface-specific player abilities in tennis forecasting, while practical modern implementations combine Elo with serve, return and recent-form features.
For readers trying to understand how the model picks, the important point is that the output is usually the end of several comparisons, not the result of one magic formula. The model may begin with a baseline strength estimate, move it for surface, adjust for recent performance, compare serve against return and then convert the combined signal into a probability.
The algorithm can vary. Logistic regression can offer an interpretable baseline; tree-based models can learn nonlinear interactions; point-based models can turn serve-point probabilities into game, set and match probabilities. Research has explored these approaches, with dynamic and surface-aware models showing the value of context.
Why point probabilities can be powerful
Tennis has a useful mathematical feature: match results are built from points, but points are grouped into games and sets. That means a small edge at point level can produce a meaningful edge at match level.
A point-based framework estimates how likely each player is to win points on serve. From there, the probabilities can be translated into service-game chances, set chances and ultimately match chances. A Bayesian point-based model published in the Journal of Quantitative Analysis in Sports used surface, tournament and date as factors in estimating point-winning probabilities.
The benefit is that the model is closer to how tennis is actually scored. A player does not need to win most points to win a match, but repeated small advantages can compound because of the structure of games and sets.
The limitation is equally important: point-level assumptions are not reality. Players change patterns, pressure changes decision-making, and point-winning probability can depend on score and opponent. A good system therefore treats the point model as a component, not unquestionable truth.
The final number should reflect uncertainty
Once the signals are combined, the system produces an estimate such as a win probability. That figure is easy to misunderstand.
A 70% projection does not mean the player must win seven times out of ten in a small sample. It means the model estimates roughly a seven-in-ten probability under its assumptions. A few contrary results do not automatically disprove it.
This is why calibration matters. A model that regularly assigns 70% probabilities to outcomes that occur only 55% of the time is systematically overconfident, even if its raw accuracy sometimes looks impressive. Conversely, a slightly less accurate model can be more useful if its probabilities are better calibrated.
The best public-facing prediction systems should therefore be judged over many forecasts, not by a handful of screenshots or memorable winners. Accuracy, log loss, calibration and out-of-sample performance reveal different aspects of quality. A prediction record becomes much more meaningful when every call is timestamped, the pre-match probability is preserved and the result is added afterward rather than rewritten.
A good tennis call can also say “no”
One of the strongest signs of a mature model is that it does not force a prediction when the evidence is weak.
Suppose the ranking gap favours one player, the recent form is mixed, the surface sample is small and the serve-return matchup is close. A system that still produces a very high confidence score is probably hiding uncertainty rather than measuring it.
By contrast, a model can lower its confidence when the signals disagree. That does not make it less useful. It makes the output more honest.
This also matters when players return after inactivity or arrive with unusual schedules. A sensible model can lower confidence when relevant information is uncertain rather than pretending it is known.
What a reader should look for in a prediction
When evaluating any tennis prediction page, the useful clues are usually hidden in the methodology. Does it distinguish hard, clay and grass? Does it use recent data without throwing away the longer-term baseline? Does it examine both serve and return rather than only aces? Does it account for the level of opponents? Does it prevent future information from leaking into historical tests?
Most importantly, does it publish what happened after the prediction?
A transparent record creates a very different standard from a promotional feed. The public can compare the forecast with the actual result, see whether the model becomes overconfident in certain conditions and identify where its weaknesses lie.
No tennis model can remove uncertainty. Injuries, weather, tactics, nerves, fatigue and variance remain part of the game. Its practical purpose is to replace vague impressions with a structured estimate that can be tested.
That is why serve, return, surface and form work best together. Serve describes how a player can start points. Return describes how the opponent can disrupt them. Surface changes the environment in which those strengths are expressed. Form tells the model whether the current version of the player looks different from the historical baseline.
The final call is simply the mathematical expression of that combined evidence.
And that may be the most useful way to think about a tennis prediction model. It is not trying to know the future. It is trying to make the future measurable enough to assign a probability, then leave the result to the court.